Fig. 1: negative sentiment and hashtags
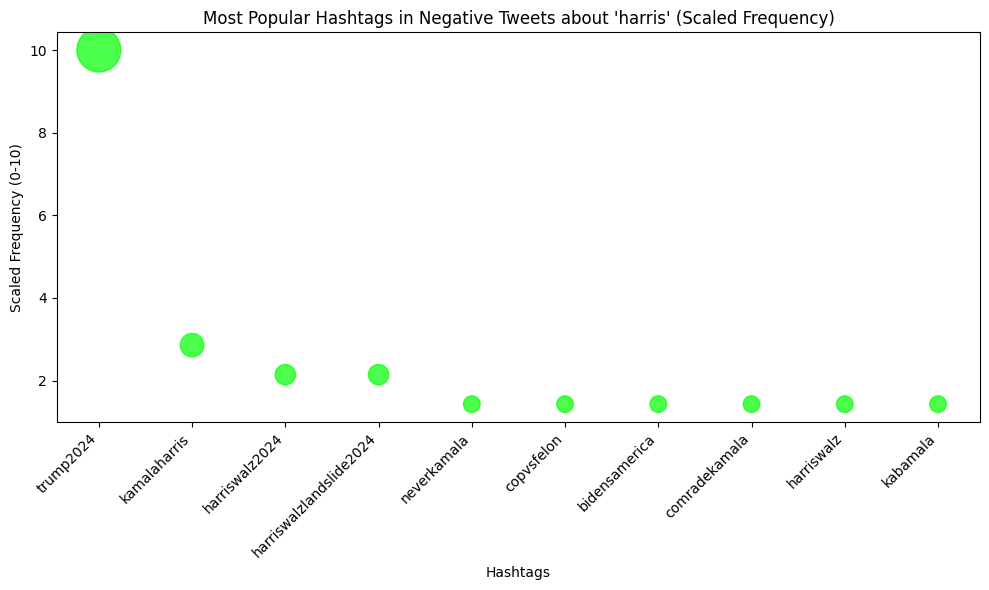
august
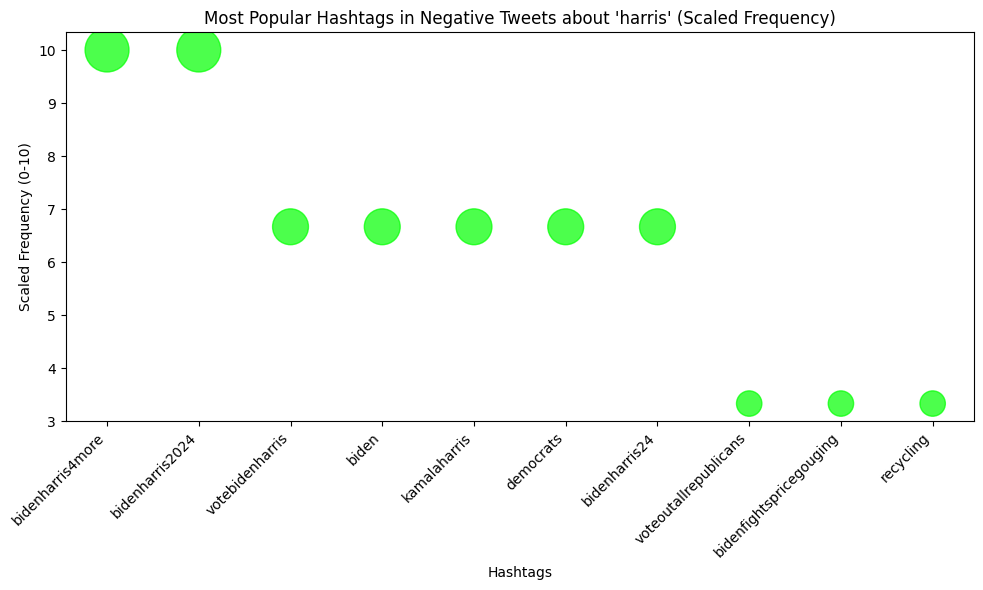
May
The above visualizations demonstrate the frequency of the 10 most popular hashtags in tweets posted in May and August that have negative sentiment towards the term “Harris,” scaled by a factor of 10. This visualization was created in Python III and was made by identifying a “bin” of tweets with a negative sentiment value for the term Harris (0 and under). I imported the “Textblob” library for natural language processing to calculate this. It then identified the most common terms with a hashtag in those tweets. One concept introduced in the literature on hashtags written by Rho et. al is that political persuasions often use the other side’s hashtags in order to engage with those they disagree with. This may or may not be the case in these initial scrapings’ findings, but poses an interesting concept for analyzing political hashtags on social media. “People shown political hashtags in news posts heavily focus on the politics of the hashtag rather than the topical content of the news story,” she writes. Seeing hashtags that mention “#bidenharris4more” but have negative sentiment suggests they may have been written in a reactionary way. Tweets with negative sentiment shifted to be peppered with hashtags that addressed Harris personally from May to August as indicated by this data set. Her name is mentioned in 7 of the top 10 hashtags up from 5 in May, and she is attacked much more personally. “Comrade Kamala,” “Kabamala,” and “Copvsfelon” are all among the most used hashtags. The distribution of hashtags also decreases overtime, as “Harris” is mentioned 508 times in May and 1831 times in August, more hashtags mention her. The amount of tweets mentioning Harris that also have hashtags increases from 62 in May to 178 in August.
fig 2. Positive hashtags and harris
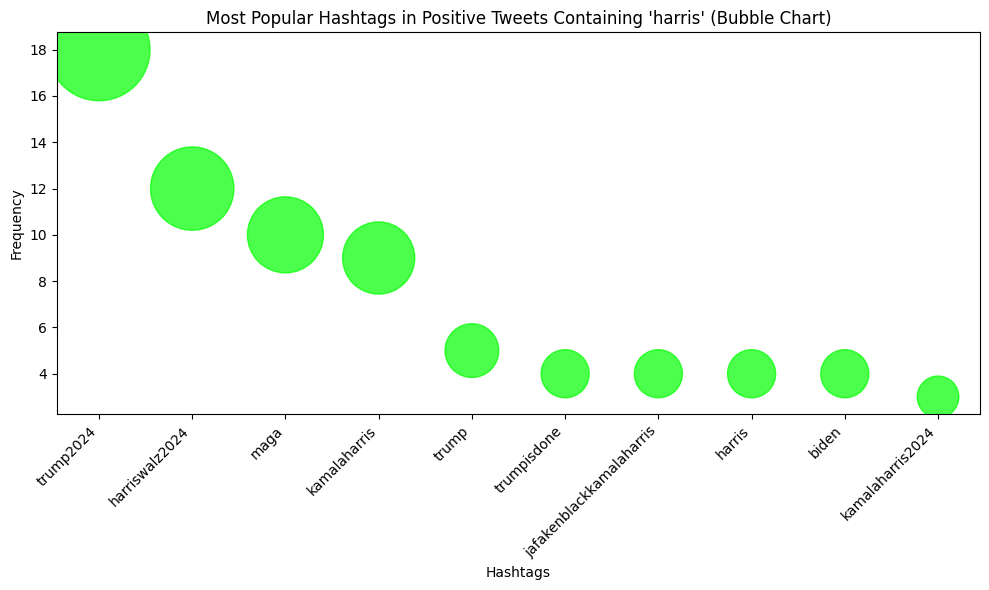
august
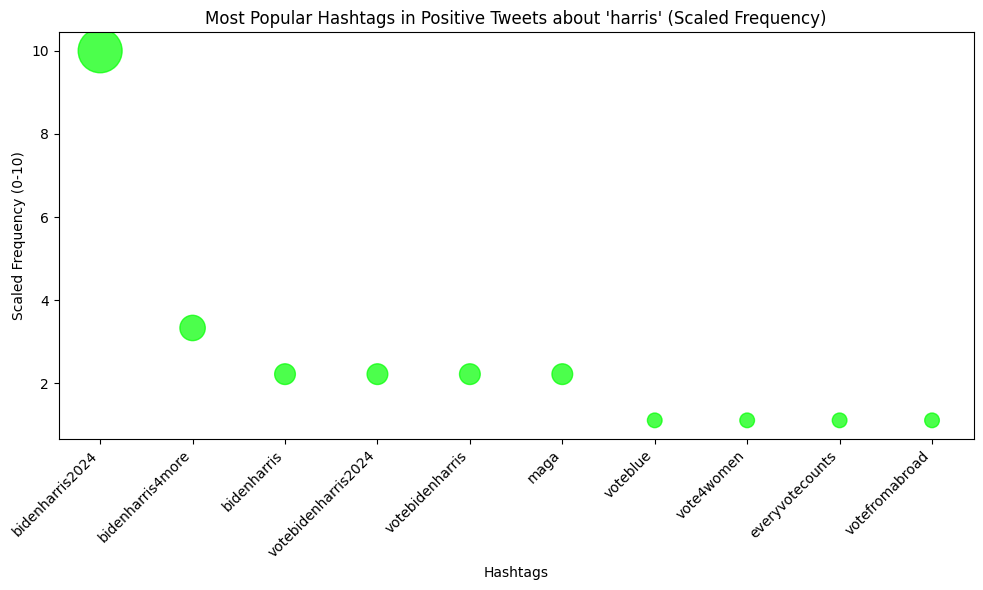
May
This visualization demonstrates the most popularly used hashtags in tweets with positive sentiment for “Harris.” It was created using Python III and the same method, filtering for tweets that both mention “harris” and contain a hashtag and have an overall sentiment value greater than 0. There is a smaller distribution of the most popular hashtags in August. Here we see trump2024 as the most popular one in August, a concept noted in the literature by Rho et. al. A notable shift is the rising popularity of “#harriswalz2024” as opposed to “#bidenharris4more,” as Harris secured the nomination at the end of July and became the focus of the democratic campaign. Another interesting factor is the sharpening of hashtags to mention Biden, Harris, and Trump specifically in August. The most popular hashtags in May are broader such as “voteblue,” “voteforwomen,” and, “votefromabroad,” while “trump,” “harris,” and, “maga” are more popular in August.
Fig. 3: adding heat
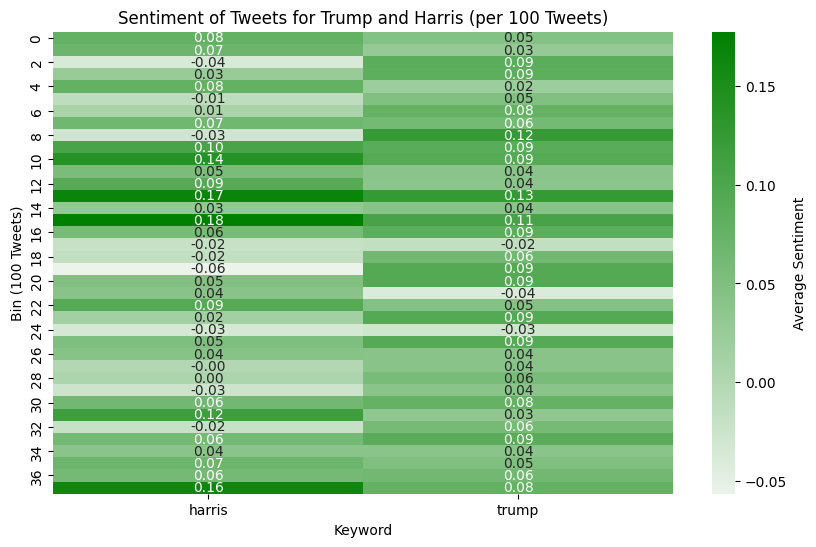
August
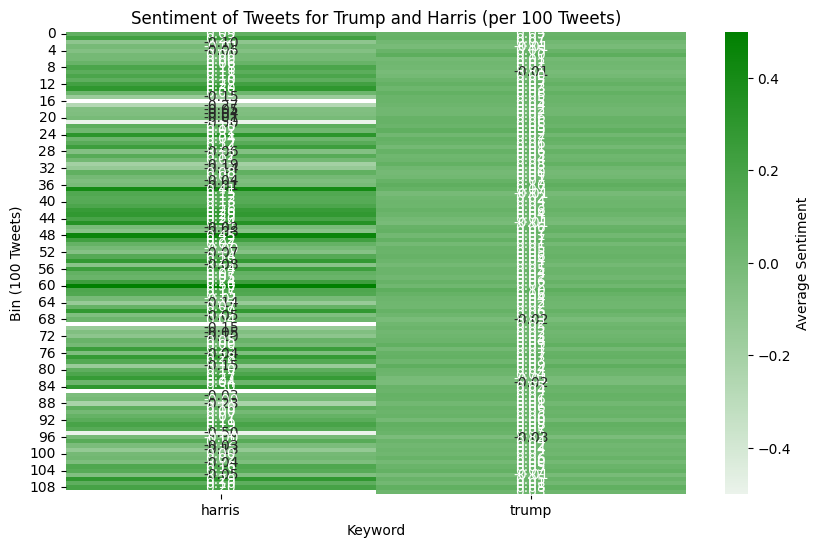
May
This visualization was produced in Python III and represents the polarization of sentiment in tweets containing the words “Trump,” and “Harris.” It was scaled per bin of 100 tweets, and collected by gathering the sentiment for all tweets and shading each one according to the level it represents. The darker the shade of green, the higher (more positive) the sentiment in tweets mentioning the candidate. A few things stand out in this visualization. Primarily, the term “harris” elicits tweets that are much more polarized in sentiment than does the term “trump.” In both May and August, the heat map for “harris” is shaded in much more bold and sparse increments, as opposed to the heat map for “trump” that skews more neutral. However in August, both Trump and Harris are mentioned with much more polarizing sentiment. According to Graham et. al, it was in July that an increased shift in engagement among right-leaning X content was made, and so perhaps more of the negative sentiment distribution for Harris and more boldly positive sentiment for Trump occurred after this time.
fig. 4 #engagement

August

May
This visualization was created in Python III by grouping tweets into two categories, those with and without hashtags. I then counted the amount of replies and retweets for both groups. The goal of this visualization was to explore Rho’s theory and see if hashtags created more comments and more spread of tweets. It should be noted that the three most popular tweets in both sets do not have hashtags. Notably, the amount of tweets replied to and retweeted that had hashtags dropped from May to August. Though the amount of retweets to tweets without hashtags remained constantly high across both time periods, reply rates across the board were significantly lower in August. This visualization in this specific dataset provides an interesting insight when taken with the literature from Rho. It suggests that the presence of hashtags, while proven by her findings to elicit more emotional and black and white responses from users, did not necessarily correlate with a higher amount of engagement on X in the time periods scraped for this data.
fig. 5 Voyant tools


This visualization was created using the platform Voyant. I input both the data from May and August, creating word formations to demonstrate the most popular terms used. I cleaned the words in Voyant to remove most userIDs, extraneous characters, and numbers that appeared. An obvious shift that appears between these two visualizations is that the word Harris appears prominently in August, when it had not in May. Voyant Tools is an online software program that allows users to make “word clouds,” by arranging the size of various terms in a dataset relative to the size of their frequency. This means that while Harris was not mentioned with frequency in May, she was in August after securing the nomination. What is also notable is the distribution of frequencies among both visualizations. There are more terms used frequently enough to appear in the visualization in August, though it appears as though the terms “biden,” “trump,” and, “gop,” are among the most used. Among these, it is clear that, “biden,” is the most popular term.
Biden’s fall from the presidential nomination definitely took up much of the political space on social media during the 2024 presidential race. It is notable that he was discussed with a higher frequency than Harris was, regardless of its sentiment. It is also notable that “she” is a term with enough frequency of use to appear in the August visualization, which is a likely reference to Harris. In a newsweek interview with Georgetown University Linguistics Professor Deborah Tannen, Tannen claims that referring to female politicians by their first name and third person pronoun rather than their last name is not uncommon. “People find women more approachable,” Tannen said. “I think that’s inseparable though from respecting them less… In many ways, women are treated by men the same way children are treated.”
Fig. 6: what was said

Created using open-access online visualization software program Tableau, this visualization demonstrates the frequency and text of the most popularly engaged with tweets the day of the election, November 5th 2024. The data was gathered using an X scraping tool available on Apify, and contains 98 tweets, their text, number of likes, replies, and retweets, and the timestamp of the Tweet. The above visualization demonstrates the most commonly retweeted, replied to and liked tweets in the dataset, as compared to the tweets with the most popular retweets replies and likes in August. This gives us a unique chance to qualitatively analyze the sentiments that were circulating moments until the election was called. The table below shows the most popular tweets, from each set and their likes, retweets and replies. In the original dataset, “Sounds like she’s gonna vote for Donald Trump,” tweeted by @JDVance received the most retweets and likes while, “Do you agree with Marjorie Taylor Greene and Jim Jordan saying all states should mandate voter ID for the 2024 elections?” tweeted by @ivankatrumpo received the most replies. In November, the most replied to, liked, and retweeted tweet was, ‘“If Kamala Harris loses, what are the odds Joe Biden resigns so Kamala Harris becomes the ‘first female president,’” tweeted by @ighaworth. All three of these accounts are right leaning and produce right leaning content to an amass of followers. @ighaworth, or Ian Haworth is a British political pundit who followed the election closely throughout the campaign, and backed Donald Trump consistently. This visualization allows you to not just see the most popular tweets, but the text of many of the most interacted with tweets throughout the course of the election cycle.